Google’s unveiled a New Search Console view, and with it, a host of new features, and changes to older features. In this article, I am going to walk through these changes, how to navigate and how to look at the data to determine the impact of structuring the data on your website.
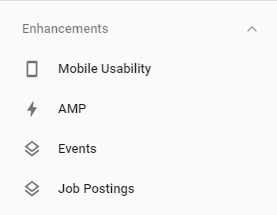
One of the most significant changes in the new view is the Structured Data Report. This was previously under Search Appearance > Structured Data Report and is now rolled into the enhancements and performance section. While, there is no longer a graph view showing all structured data on the site over time, as there was in the previous version of search console, the enhancements contain the rich results or features tied to certain structured data. When the new version was first released this contained AMP, and Job Postings. Since its release, Mobile Usability and Events has also been added to the enhancement section with the promise of more to come according to the following Google Webmasters’ blog post.
These enhancements show any errors or warnings related to the schema markup that is informing those rich results, as well as any valid instances of markup. While this is typically the source of truth for what Google is seeing on pages, our team has uncovered some misattributed errors to these enhancements on our client’s properties. If you are seeing these please visit our quick tip blog post “How To Resolve Misattributed Errors In The New Google Search Console” for a complete walk-through.
Now, let’s cover how you can dig into Search Console to find out how your structured data is impacting the performance of your website. First, we will need to navigate to the performance section from the left hand sidebar.
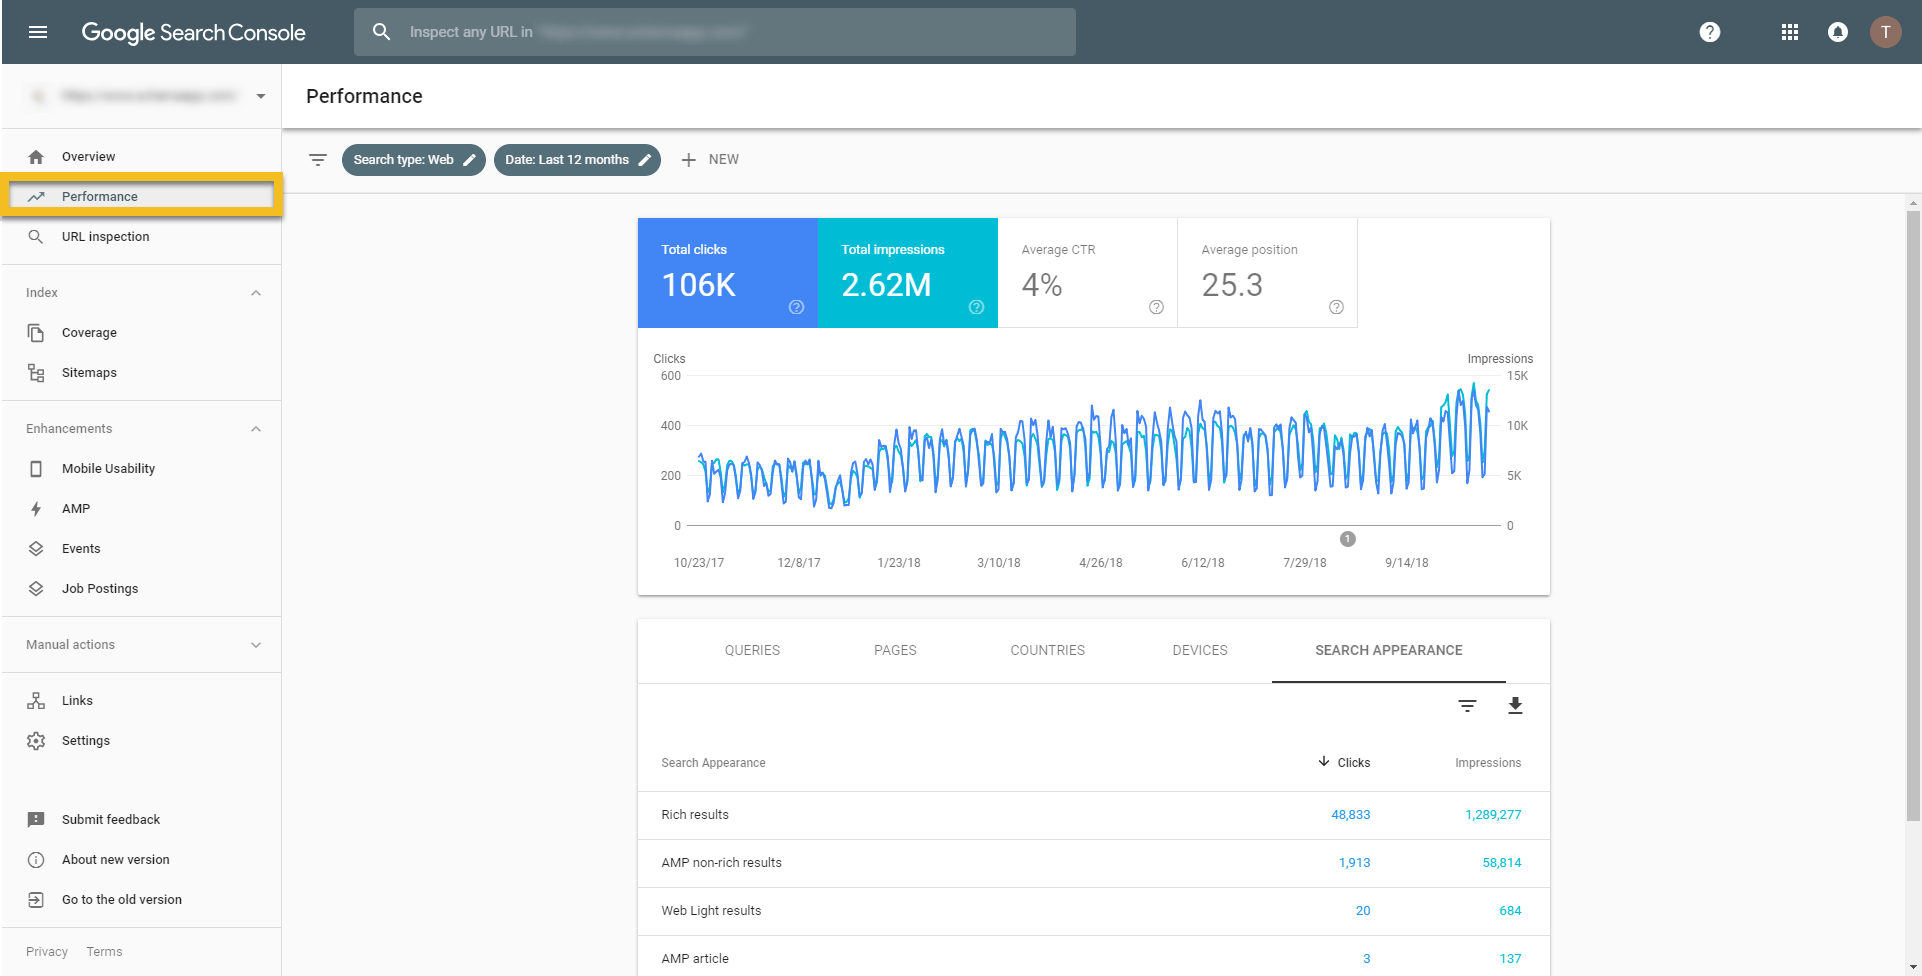
Once we are here, we will see our total clicks (or traffic), total impressions, average click-through rate (CTR), and average position, which we can toggle on and off to see the trend line on the graph. By default this will show a last 3 months view, but this can be adjusted to whichever time period would be relevant.

From this point we can segment the performance results to find when we introduced certain structured data by navigating to the top of the view and clicking “+ New”, as shown here:

For the time period, we would want this to capture the data before we introduced Schema Markup to view as a benchmark to see how this compares. We can either include a date range earlier than when we introduced Schema Markup, or we can modify the time period to compare two ranges. For example, month over month, year over year, or quarter by quarter.
Additionally, you can segment the performance view by page and by search appearance. To go after the lowest hanging fruit, we can use these to find out the impressions, clicks, click-through rate, and average position of any rich results that are being achieved. We can do this by setting the search appearance filter to rich results. To take this a step further, if we have a friendly url structure, for example a url that contains “/products/” where we might expect those rich results, we can set this in the page filter.
Now, if your experience with Schema App has been your first foray into schema markup and there was no structured data previously, you might see something like this when you begin to achieve rich results:

You may see this trend, and other increases in these metrics after removing the search appearance filter for rich results. This will allow you to correlate the rich results with the overall site traffic to either, determine which portion of the traffic is represented by the rich results or to identify any significant improvements in overall traffic volume or traffic quality that have increased in tandem.
If you need a hand getting started with your structured data strategy, we’ve helped customers such as SAP and Keen Footwear drive more quality search traffic to their websites.
Start reaching your online business goals with structured data.

Martha van Berkel is the co-founder and CEO of Schema App, a semantic technology company that helps enterprise brands control how they are represented in AI and search. By building a semantic data layer, Schema App enables organizations to improve visibility, protect their brand, and drive more efficient organic growth. She focuses on helping marketing teams navigate the shift from traditional SEO to AI-driven discovery by establishing a structured source of truth for their content.